April 2, 2024
How close to insolvency are you? The Altman Z-Score
A quick scan of this list and the negative scores might give you a clue as to what the table means. Not good.

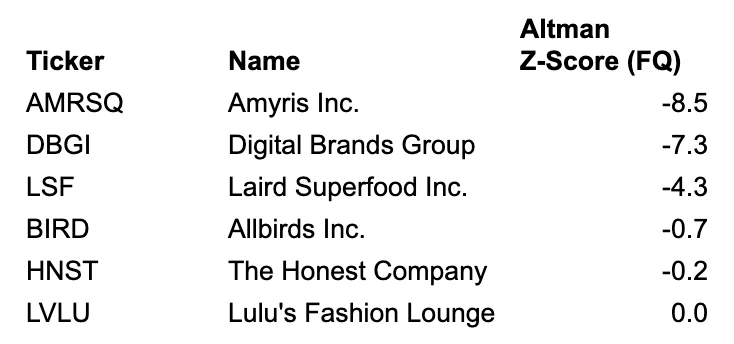
A quick scan of this list and the negative scores might give you a clue as to what the table means. Not good.
These are the 6 companies in the March 2024 Elephant Herd Index of 56 brands and retailers with Altman Z-Scores of zero or below.
Background
The Altman Z-Score is a predictor of bankruptcy developed by NYU Stern Finance Professor Edward Altman in 1968 and refined often since then. Through statistical analysis he found that Z-Scores were highly predictive of impending bankruptcy and in subsequent tweaks has improved the scores predictiveness. These scores were originally focused on public companies in manufacturing which seems to have been broadly enough defined to include brands and retail but did not include finance and services.
Originally, scores were put into zones:
- 2.99+ = Safe
- 1.8 - 2.99 = Gray
- < 1.8 = Distress
Altman has noted more recently that the zones are not the best way to interpret scores because capital markets and access to capital will change and a company’s score relative to peers is more important than absolute scores across all types as nuance of specific sub industries will impact scores. Altman and others have refined the score to include non-public companies, companies in emerging markets and companies in services.
All that said, a quick way to interpret an Altman Z-Score is:
- the higher the better
- close to zero or (below) is cause for concern
- how companies look relative to each other is important
How Altman Z-Scores are calculated
The components of the Altman Z-Score are a fascinating way to think about a company. A quick note, there are multiple versions of the Z-Score that have been developed over time, Z, Z-prime (Z’), Z-double prime (Z”). I am going to focus on Z which is what you find most often as you google around.
The Z-Score has 5 elements. Each element is a ratio multiplied by a weighting. The score is then the sum of those elements. Before we look at each element, I think a fair summary of the formula is that it looks to three main concepts of how well a company is doing:
- how efficiently does the company use assets. This is captured in 3 elements.
- what is the short term liquidity of the business?
- what does the market think about the company?
Let’s look at the formula in more detail by going through each element. In order of weighting, the Z Score is:
- How efficiently does the company use its assets to generate profits?
- How well has the company generated profits over time?
- What is the short term liquidity of the company?
- How efficiently does the company use assets to generate sales?
- What does the market think about the prospects for this company?
Do higher scores indicate better companies?
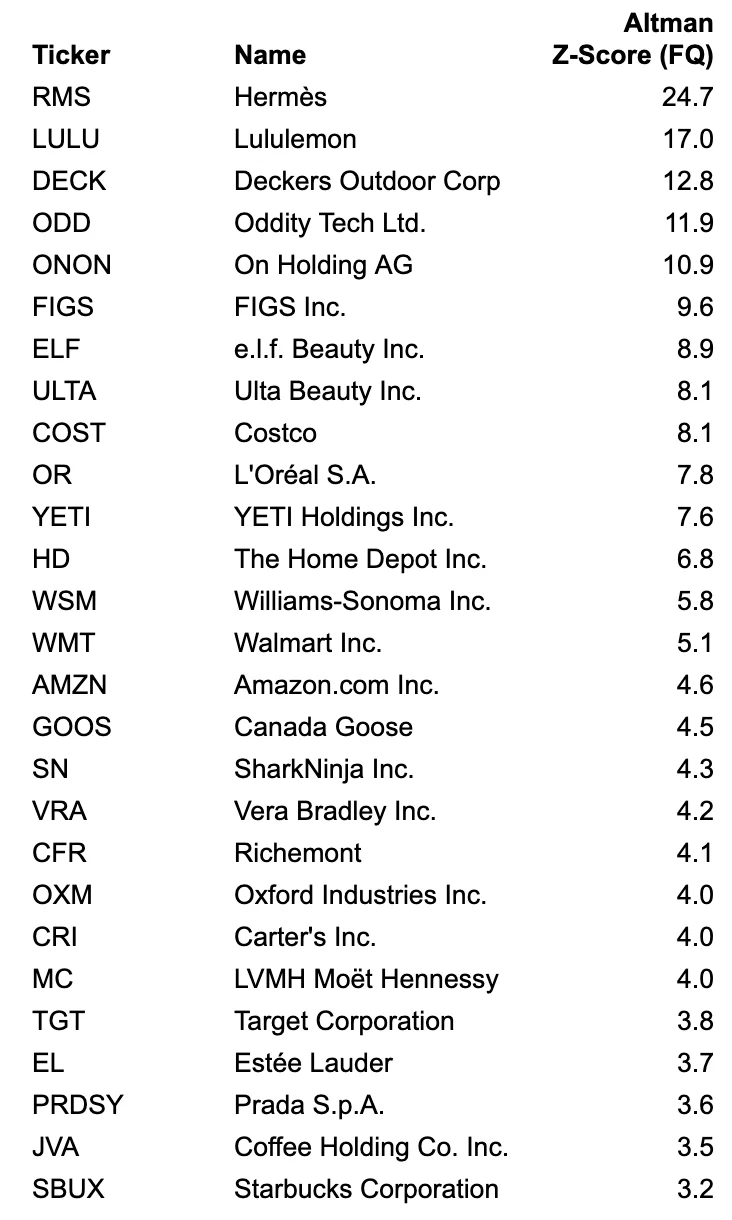
It’s not surprising to see Hermes and Lululemon at the top of this list. The efficient use of assets to produce sales and profits now and in the past plus high short term liquidity plus strong market sentiment about financial health means high scores.
How can I use this for my private company?
Four of the elements underlying the Z-Score are applicable to private companies. Because private companies don’t have easily determined and liquid market caps, the the market cap element has been changed to book value of equity. In addition, the weightings have changed. The formula for private companies Z’ (Z-prime) is below.
- (EBIT / Total Assets) * 3.107
- (Sales / Total Assets) * 0.998
- (Retained Earnings / Total Assets) * 0.847
- (Working Capital / Total Assets) * 0.717
- (Book Value of Equity / Total Liabilities) * 0.42
The math is the same as above. You calculate each element and then add them up. The zones also stay basically the same as above.
Monitoring your own Z-Score helps you understand how close to the edge of insolvency you are or how good a job you are doing. Making the changes to improve your score over time means you are running a better business.
Z-Scores are often used by lenders. Knowing your own Z-Score and its trend ahead of time will prevent surprises in due diligence as well as monitoring. In other words, you want to know before you lenders about potential issues.
Sources and more reading
To see Altman Z-Score for top brands and retailers, check out the Elephant Herd Index:
https://docs.google.com/spreadsheets/d/1xuBBKMZQI6utSw4op8jNWCxbvoJiLyR0dnyk8hkl5io/edit?usp=sharing
Some good summaries
https://www.wallstreetprep.com/knowledge/altman-z-score/
https://corporatefinanceinstitute.com/resources/commercial-lending/altmans-z-score-model/
Z-Score for private companies (Z’ Z-prime) formula
Altman slide deck on uses and changes over time
https://www.hofstra.edu/pdf/community/bdc/breslin/breslin-evolution-of-altman-z-score.pdf
YouTube lecture of Altman at LSE discussing 50 years of the Z-Score